Stonegate Acoustics

Design and planning
Project Management
A typical project will normally start with a detailed analysis of existing and competitor products and their respective technologies. The concept phase ensures that the core ideas are thoroughly thought through and coalesce into the desired target design. Project planning is used to ensure performance, timescales and costs are met.
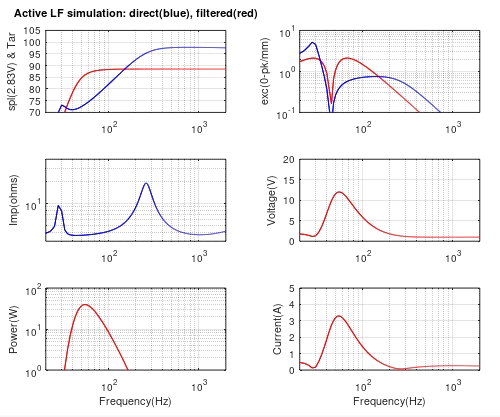
Lumped-Element Driver/Box and System Simulations
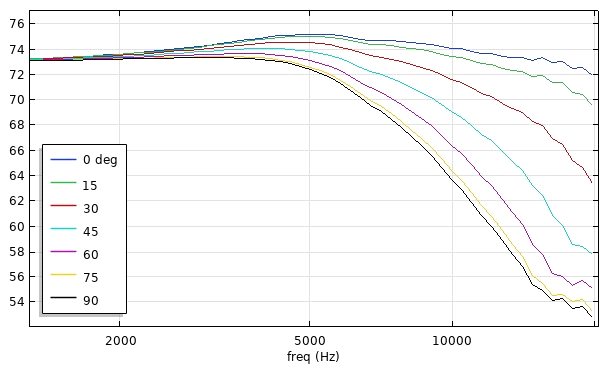
Commercial and custom software is used to analyse and specify driver parameters and box loading for each specific application. A multi-way system is simulated to ensure the target alignment is clearly determined and will give the required acoustic response both on- and off-axis. The high-level performance is simulated to ensure stable operation under heavy load or power test conditions.
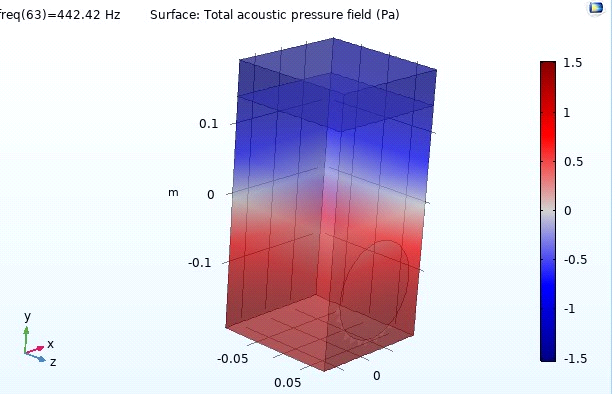
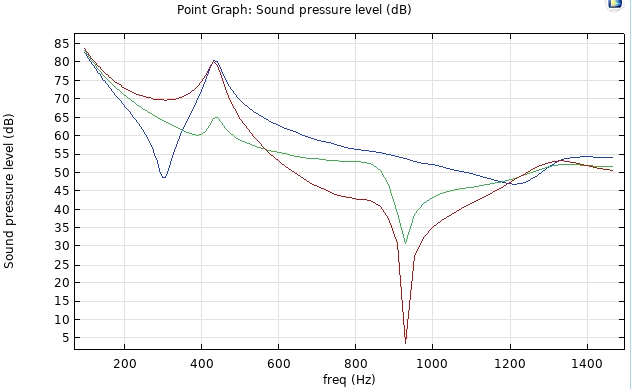
Boundary and Finite Element Simulations (Comsol, ABEC3, Pafec PafLS)
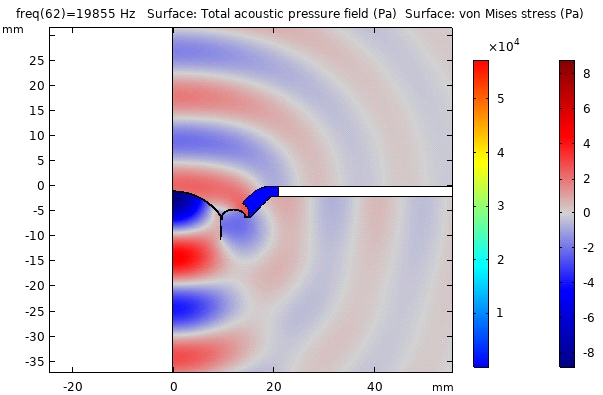
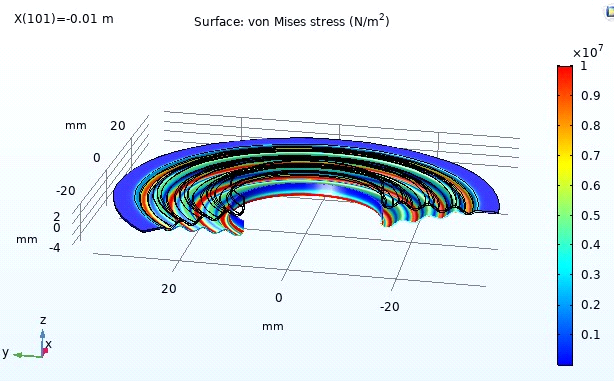
Boundary and finite element simulations are extensively used for driver design, magnet systems and radiation/diffraction from drivers mounted in their enclosures.
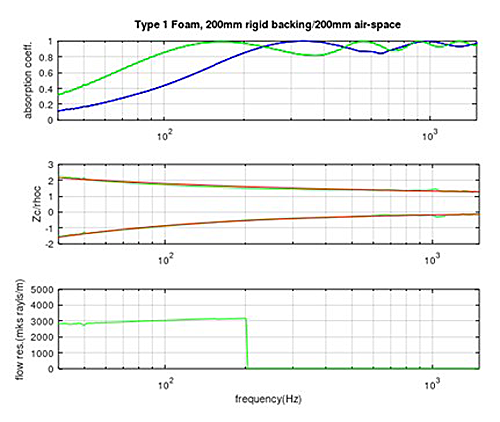
Internal acoustic field including porous materials
Driver structural and acoustic performance
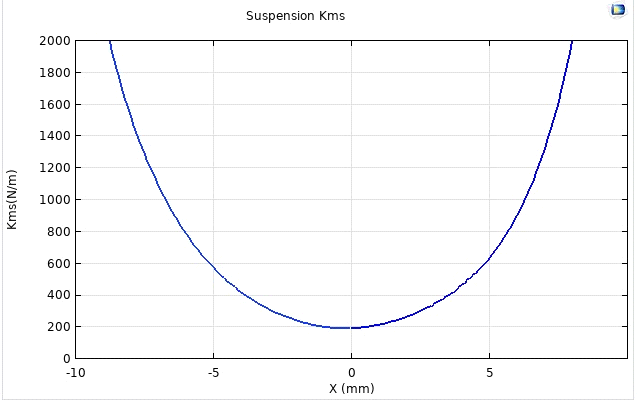
Suspension and surround linearity
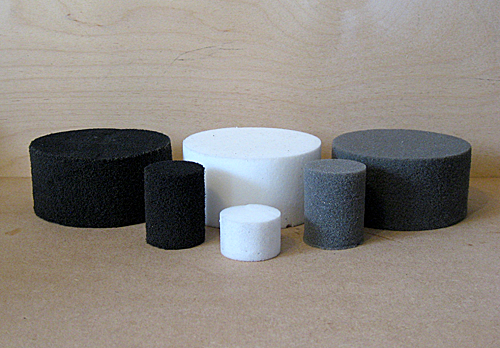
Impedance tube measurements of porous materials and their characterization for FEA simulations
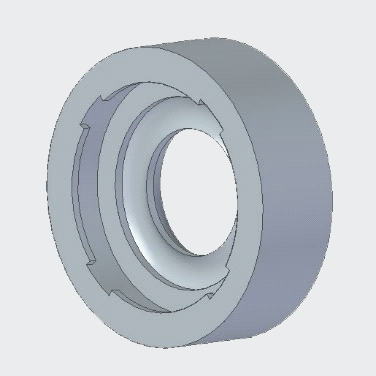
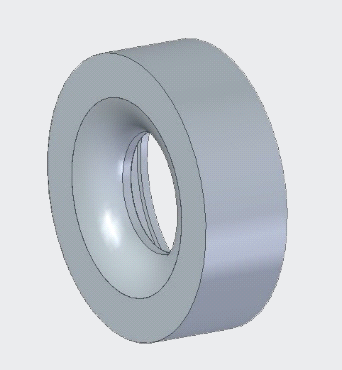
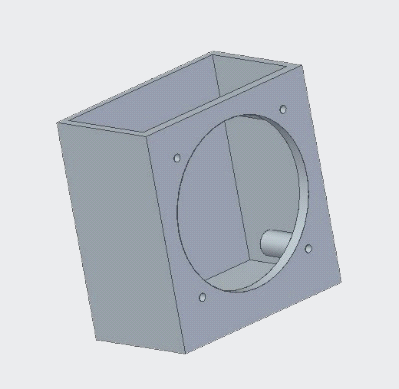
Technical Drawing 2D/3D CAD (Solid Edge)
2D and 3D CAD is used to design and detail parts for 3D printing, FE/BE simulations and documentation.
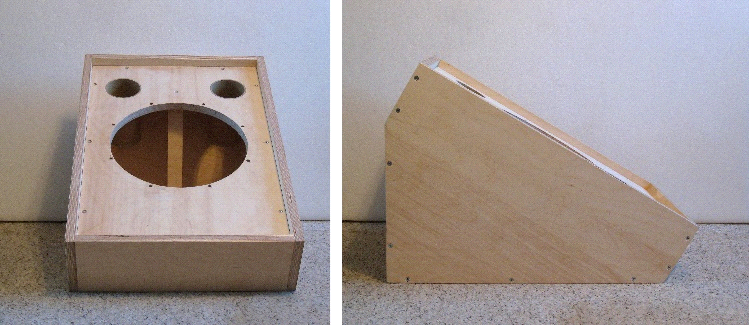
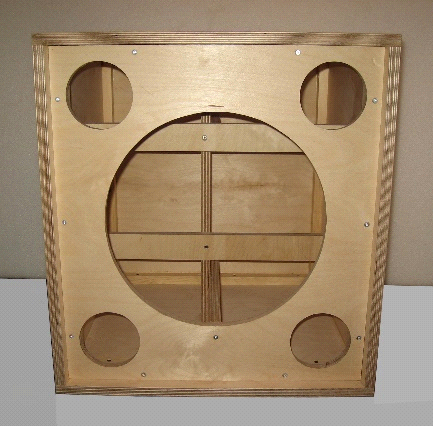
Cabinet/Enclosure Build (3D printed/ Wood)
The smaller and more intricate enclosures, as well as component parts such as tweeter faceplates, can be 3D printed with an in-house Ultimaker printer. Larger structures are made in-house from MDF or birch ply.
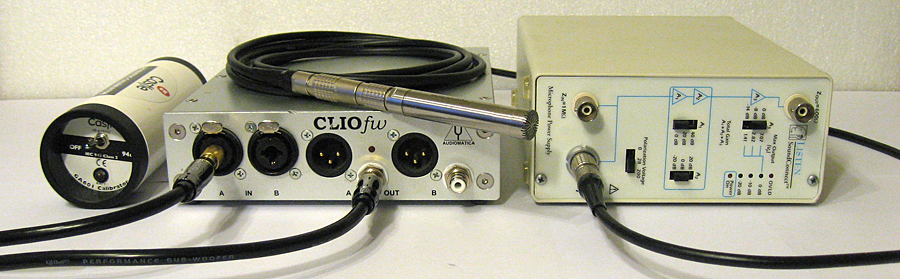
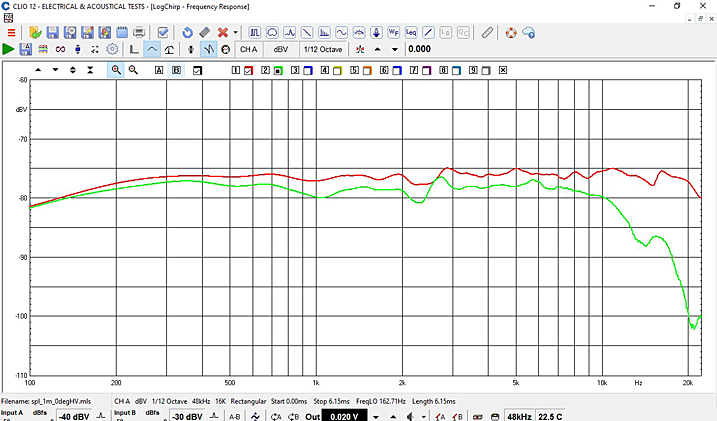
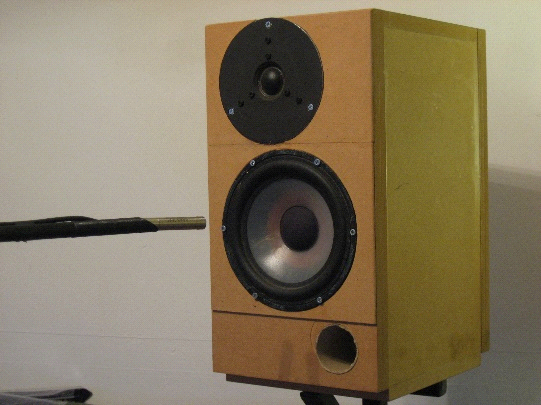
Acoustic and Structural Measurements (CLIO 12/B&K/GRAS)
Great care is taken to ensure measurements are accurate and reliable. The excellent CLIO 12 system is the main measurement system of choice combined with B&K and Gras microphones and accelerometers.
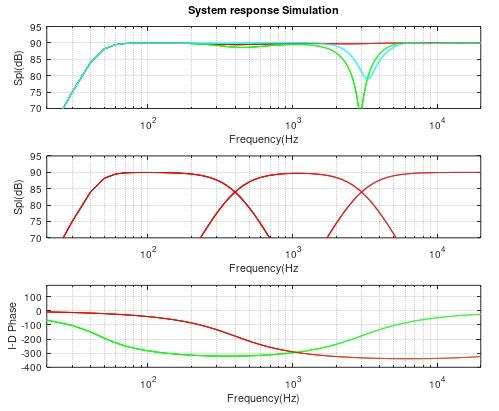
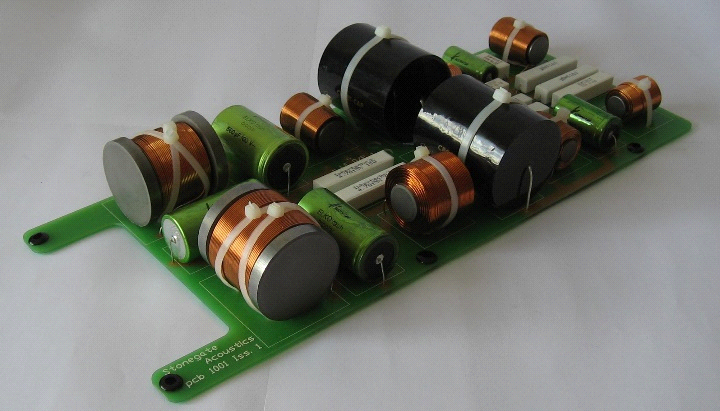
Crossover Design
Passive crossover filters are simulated relative to target curves and analysed for component ratings and tolerances, before being built up and tested for response accuracy and distortion. Active filters are simulated and implemented using loudspeaker management systems.
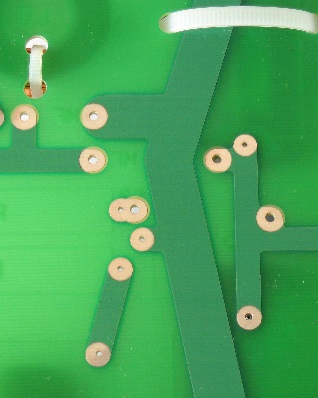
Passive Crossover PCB Design
It is critical the components and tracks are laid out carefully to avoid interactions and unwanted distortions. A well-designed passive crossover, with carefully specified components and pcb, can have excellent and reliable low-distortion performance.
Listening Tests (Stereo/Multichannel)
Listening tests are the crucial stage in the development process where one can judge the design as the customer does. Ideally, the chosen response alignment correlates nicely with the desired subjective performance, however, some small adjustments are normally necessary before one feels the performance has been optimised. Measured performance is always correlated with listening tests to either confirm or expand one’s database of subjective-objective relationships.